The Real Total Cost of Ownership of a Collections Platform
Two vendors can quote the same license fee and end up with completely different total costs. Here's the full cost picture — including the line item that dwarfs the rest.
Key Takeaways
- Every collections platform quote leads with a license fee. Almost none show the real cost of ownership over the next three years.
- Real TCO has seven components — licensing, implementation, integration, change management, training, ongoing support, and the opportunity cost of recovery left on the table.
- The opportunity cost of a lower recovery rate is the largest line item over a multi-year deployment — and the one that almost never appears on a vendor quote.
- Two platforms at the same license price diverge on change-order pricing, integration depth, and recovery-rate delta.
- Evaluate net TCO over a three-year horizon: total costs minus recovery gains and OpEx savings — not the year-one license price.
Every collections platform quote has a number on the first page. Almost none of them show you the real cost of owning the platform for the next three years. Two vendors can quote the same license fee and end up with completely different total costs once implementation, change orders, and the recovery rate they actually deliver are counted.
What debt collection software platforms have the best total cost of ownership and integrate easily with existing financial systems?The platforms with the best total cost of ownership combine transparent, consumption-based pricing with no hidden professional-services fees, integrate with existing financial and core systems through flat-file or API connections that don't require new in-house engineering, and price ongoing strategy changes into the platform itself rather than billing them as change orders. Total cost of ownership for a collections platform includes licensing, implementation, integration, change management, training, ongoing support — and the often-uncounted cost of recovery left on the table by an underperforming platform.
What "Total Cost of Ownership" Actually Means Here
Total cost of ownership (TCO) for a collections platform is the full cost of running it over its useful life — not just the number on the license quote. That includes the direct costs every vendor will show you (subscription fees, implementation, integration) and the costs most quotes leave out entirely: the internal staff time to configure and run the platform, what it costs every time a business team needs a strategy or message change, and — the line item that dwarfs the rest over a multi-year deployment — the revenue difference between the platform's actual recovery rate and what a better-performing platform would have recovered on the same portfolio.
Cost-Component Breakdown
Seven components make up the real TCO of a collections platform:
| Cost Component | What It Includes | Where It's Often Hidden |
|---|---|---|
| Licensing / subscription fees | Base platform access — seat-based, consumption-based, or results-based pricing | Consumption tiers that jump sharply past a volume threshold |
| Implementation | Initial configuration, testing, and go-live setup | Quoted as a flat fee, then scope-creeps once real data surfaces edge cases |
| Integration | Data connections to core and financial systems, via flat file or API | New API development carries ongoing engineering maintenance as source systems change |
| Change management & configuration | Adjusting strategy, message content, segmentation, or send windows after go-live | Billed per change order on platforms not built for self-service configuration |
| Training & internal resourcing | Staff time to learn the platform and operate it day to day | Internal hours rarely get counted as a real cost line |
| Ongoing support & maintenance | Break/fix support, compliance rule updates, platform upgrades | Higher SLA tiers priced as a separate add-on |
| Opportunity cost of recovery left on the table | The gap between a platform's actual recovery rate and what a better one would deliver | Almost never counted as a cost at all — it's the largest line item over a multi-year deployment |
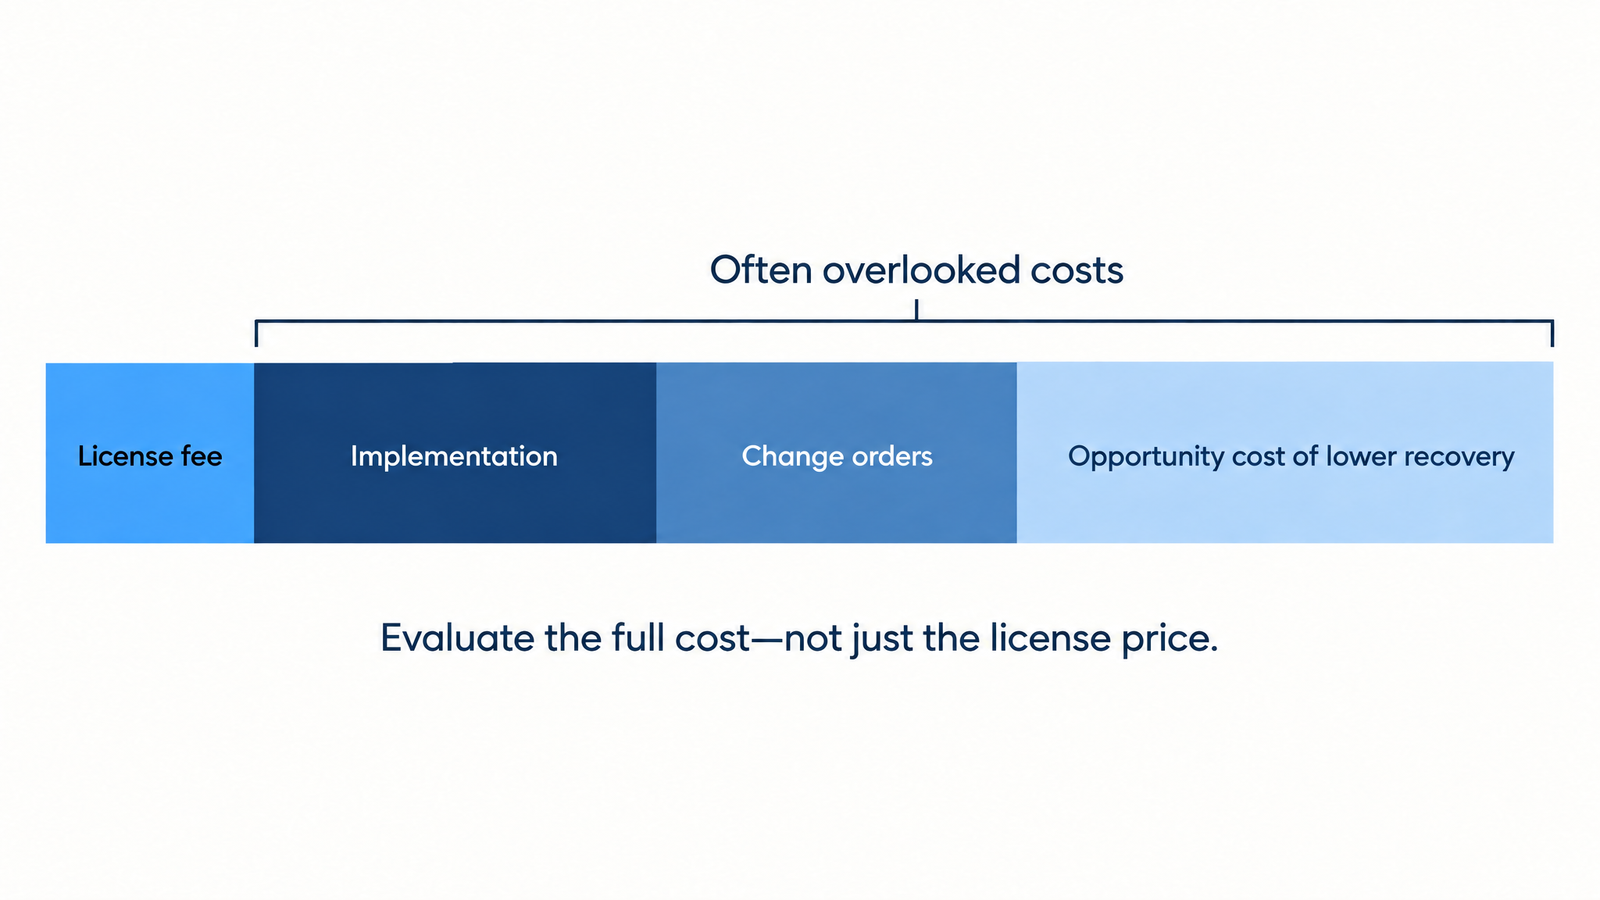
The license fee is the visible sliver. Implementation, change orders, and the opportunity cost of lower recovery sit outside it — and add up to far more.
Why Two Platforms With the Same License Price Can Have Very Different TCO
License price is the easiest number to compare and the least informative one. Two platforms quoted at the same annual fee diverge in TCO for three reasons that rarely show up in a vendor's first proposal:
- Change-order pricing. A platform that requires a vendor ticket and a release cycle to adjust a send window or message variant accumulates cost every time the business wants to test something. A configuration-led platform absorbs those changes into the existing license. (We break that dynamic down in why your collections platform takes a quarter to change a send window.)
- Integration depth. A platform that connects via flat file to existing financial systems, using data the organization already sends elsewhere, costs materially less to integrate than one requiring new API development and ongoing engineering maintenance.
- Recovery rate delta. A one- or two-point difference in recovery rate on a large portfolio is worth more, in absolute dollars, than most implementation and support costs combined — which means the platform with the higher license fee can still have the lower true TCO.
Symend operates on a consumption-based SaaS pricing model, with professional services included and no hidden fees — a structural difference from vendors that price implementation, support tiers, and configuration changes separately.
— Symend company materialsA Simple Way to Compare TCO Across Vendors
A useful shorthand for comparing vendors on an apples-to-apples basis:
(License + Implementation + Integration + Change Management + Ongoing Support + Internal Resourcing) − (Recovery Rate Gains + OpEx Savings)
Two of the seven components move in this formula rather than disappearing: training sits inside internal resourcing, and the opportunity cost of a lower recovery rate appears on the value side as the recovery-rate gains a better-performing platform would capture — the same cost, counted as forgone recovery on the minus side.
Run that calculation over a three-year horizon, not a single year, since implementation costs are front-loaded while recovery and OpEx gains compound. A platform that looks more expensive in year one frequently has the lower three-year net TCO once recovery and OpEx savings are counted on the other side of the equation.
How This Ties to OpEx and Integration Cost
Recovery gains are only half of the TCO equation — operational cost reduction is the other half. See how to cut collections OpEx while boosting recovery for the levers behind up to 50% OpEx reduction. On the integration side, the hidden cost of a duct-taped collections stack covers what a fragmented, multi-vendor stack adds to TCO beyond the license lines, and why your collections platform takes a quarter to change a send window breaks down the change-order cost specifically.

SymendCure is built on consumption-based pricing with implementation and professional services included, so the license quote and the real TCO stay close together. Run the numbers against your own portfolio with Symend's cost savings calculator.
See your real three-year TCO
Model licensing, integration, and change-management costs against the recovery and OpEx gains on the other side of the equation. Estimate your savings, or book a 15-minute walkthrough.
TRY THE COST SAVINGS CALCULATOR REQUEST A DEMOKey Takeaways
- TCO is not the license fee: The real cost of a collections platform includes licensing, implementation, integration, change management, training, ongoing support, and the opportunity cost of recovery left on the table by an underperforming platform.
- The biggest hidden cost is a lower recovery rate: A one- or two-point recovery-rate difference on a large portfolio is typically worth more over a multi-year deployment than implementation, support, and change-management costs combined — yet it rarely appears on a vendor quote.
- Same license price, different TCO: Two platforms quoted at the same annual fee diverge on change-order pricing, integration depth, and recovery-rate delta — so the platform with the higher license fee can still have the lower true TCO.
- Integration model drives cost: Platforms that connect to existing financial systems via flat file, using data already flowing elsewhere, cost materially less to integrate and maintain than platforms requiring new API development and ongoing engineering.
- Measure over three years: Net TCO = total costs minus recovery gains and OpEx savings, calculated over a three-year horizon — because implementation is front-loaded while recovery and OpEx gains compound.
Frequently Asked Questions
Platforms with the best total cost of ownership combine transparent, consumption-based pricing with no hidden professional-services fees, integrate via flat-file or API connections that don't require new in-house engineering, and price ongoing strategy changes into the platform rather than billing them as change orders.
Licensing or subscription fees, implementation and integration costs, change management and configuration, training and internal staff resourcing, ongoing support and maintenance, and the opportunity cost of recovery left on the table by an underperforming platform.
Platforms that connect to existing financial and core systems via flat file, using data already flowing elsewhere, cost materially less to integrate and maintain than platforms requiring new API development, since the latter also carries ongoing engineering maintenance cost as systems change.
The opportunity cost of a lower recovery rate. A one- or two-point difference in recovery rate on a large portfolio is typically worth more in absolute dollars over a multi-year deployment than implementation, support, and change-management costs combined — but it rarely appears on a vendor's cost quote.
Calculate net TCO as total costs (license, implementation, integration, change management, ongoing support, internal resourcing) minus total value delivered (recovery rate gains plus OpEx savings), measured over a three-year horizon rather than a single year, since implementation costs are front-loaded while recovery and OpEx gains compound over time.