
The K-Shaped Consumer
Why every aggregate dashboard is wrong about consumer stress

Why do aggregate delinquency dashboards miss consumer stress?
Aggregate dashboards average a split population. Since 2019, more consumers have moved into super prime while debt-to-income rose fastest among near-prime and subprime borrowers. A portfolio can report stable delinquency while a concentrated, lower-income cohort inside it deteriorates. That split is the K-shaped consumer, and averages hide it.
The headline numbers read like an all-clear
The New York Fed’s latest Household Debt and Credit Report reads like good news. Total household debt slipped to $18.8 trillion, and the share of debt in serious delinquency fell from 2.91% to 2.57% year over year.¹ Credit-card charge-offs at commercial banks declined from 4.19% to 3.82%.² An executive skimming these numbers would conclude the consumer is fine.
What is the K-shaped consumer?
TransUnion’s read of the same period tells a different story, and its title gives the game away: the credit market is “increasingly splitting along a K-shaped path.” Since 2019, the share of consumers scoring super prime has grown from 36.9% to 40.7%, as fifteen million people moved up, while the prime and near-prime middle shrank.
Meanwhile, non-mortgage debt-to-income rose 29 basis points for super prime consumers, 176 for near prime and 143 for subprime. The largest additions landed on bases already close to three times as leveraged.³
Stress concentrates at the bottom of the K
The distributional data is starker still. In America’s lowest-income ZIP-code decile, 17.9% of people with a credit card were 30 or more days past due in early 2025. In the highest decile, 6.0% were.⁴
Share of cardholders 30+ days past due in the lowest- vs. highest-income ZIP-code deciles, early 2025.
Source: Federal Reserve Bank of St. Louis
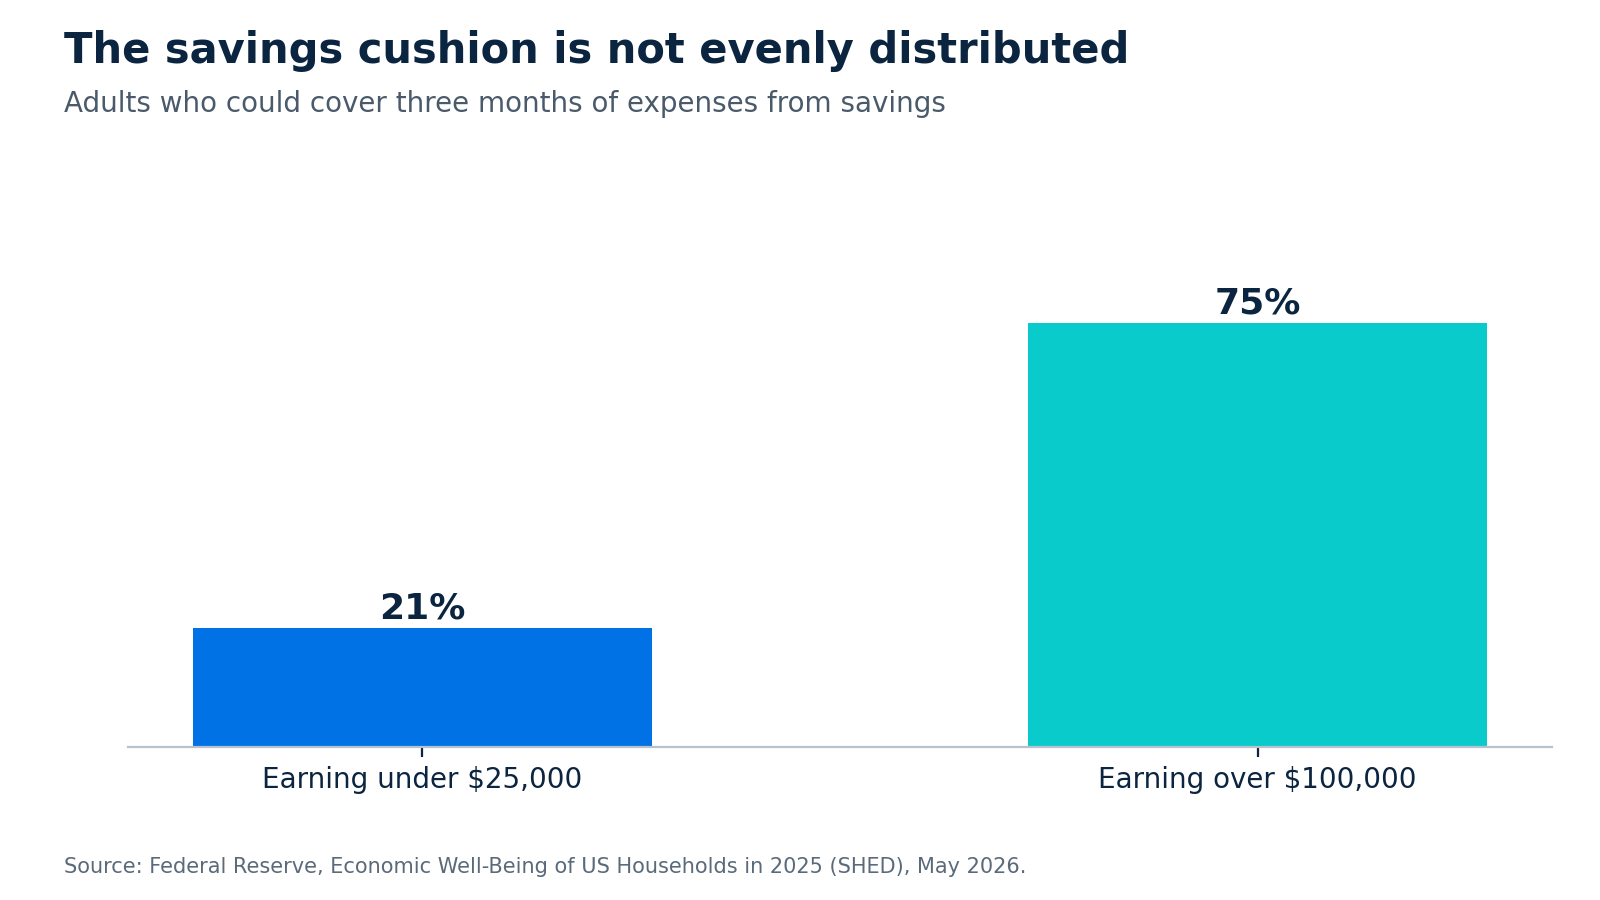
The Fed’s own well-being survey finds that only 21% of adults earning under $25,000 could cover three months of expenses from savings, against 75% of those earning over $100,000.⁵ Roughly a quarter of households now live paycheque to paycheque, and nearly all of the recent growth in that group came from lower-income households.⁶ Utility arrears reached approximately $25 billion, with about one in six households behind.⁷
Even the delinquency data is misleading
The New York Fed spent part of this summer reconciling why two delinquency measures diverge. It found that the alarming one, the share of card balances 90 or more days past due, is inflated “almost entirely” by a reporting artefact: charged-off debt now lingers on credit files far longer than it used to, with 80% of charge-offs still reported a year later against 40% historically.⁸
“The stock measure is too scary; the flow measure is too calm. Neither tells a credit or collections executive what is happening to which customers.”
Distribution, not direction
A portfolio dashboard built on averages will report stability right up until the concentrated cohort inside it breaks. The stress is real, it is large, and it is invisible at the level of aggregation where most executive reporting lives.
None of this is a crash call. Flows into serious delinquency have been stable since 2024, and several stress measures have stopped worsening. The argument is about distribution, not direction.
“Whichever way the cycle turns, the averages will describe almost nobody.”
What this means for issuers
The first question to ask of any portfolio metric is no longer “what is the trend?” but “what is the distribution underneath the trend?” For banks and card issuers, that means segmenting on how customers actually behave, the approach behind SymendCure’s Delinquency Archetypes, rather than managing to a portfolio average. For the card portfolio specifically, see why traditional collections won’t work in 2026.
The bottom line
Calm averages and concentrated stress can coexist for a long time. The full paper, “The Averages Are Lying,” carries the complete argument: the behavioural signals that lead delinquency, why identical scores conceal opposite customers, and the playbook for acting upstream.
A 7-part series
The New Delinquency Playbook
Seven short posts drawn from two Symend research papers. The first, “The Averages Are Lying,” argues that consumer stress has become concentrated rather than widespread, that delinquency is a lagging indicator, and that credit scores have decoupled from behaviour, so issuers need to read behaviour early, re-segment on it, and move intervention upstream. The second, “AI Is an Engine,” argues that collections AI amplifies whatever operating philosophy it is given, so it only works when behavioural science steers it, outcome objectives replace deflection metrics, and credit decisions stay on the deterministic side of the line.
From “The Averages Are Lying”
- Part 1 of 7 Delinquency Is a Lagging Indicator The behaviour that predicts default shows up one to two years before the missed payment
- Part 3 of 7 Same Score, Different Customer Credit scores have decoupled from behaviour — and treatment built on them shows it
- Part 4 of 7 The Prevention Curve The economics of acting before the roll
From “AI Is an Engine”
- Part 5 of 7 The 95% Problem Collections is adopting AI faster than it is getting results
- Part 6 of 7 The Stigma Exception Most consumers dislike service AI. Debt may be different — if the engine is steered right
- Part 7 of 7 The Deterministic Line What AI must never decide in collections — and where it earns its keep
Frequently asked questions
What is the K-shaped consumer?
A consumer economy splitting in two: higher-income, higher-score households improving while lower-income and near-prime households take on more debt and fall behind. TransUnion describes the US credit market as moving along this path.
Is consumer credit stress rising in 2026?
Headline measures look stable or improving, and flows into serious delinquency have been steady since 2024. The stress is concentrated rather than widespread, which is why averages miss it.
How does delinquency differ by income?
Sharply. In early 2025, 17.9% of cardholders in the lowest-income ZIP-code decile were 30+ days past due, against 6.0% in the highest.
Why are aggregate delinquency metrics misleading?
They average two diverging groups into one number, and some are distorted by reporting changes, such as charged-off debt staying on credit files longer than it used to.
What should collections leaders track instead of averages?
The distribution beneath each metric: which cohorts are deteriorating, how they engage, and how they respond to treatment.
Endnotes
- Federal Reserve Bank of New York, Quarterly Report on Household Debt and Credit, Q2 2026 (released 2026-08-11). newyorkfed.org/newsevents/news/research/2026/20260811. Debt-service ratio: Federal Reserve Board, via FRED series TDSP — 11.16% of disposable income, Q1 2026, essentially flat for five quarters.
- Federal Reserve, charge-off rate on credit-card loans, all commercial banks (FRED series CORCCACBS), Q2 2026.
- TransUnion, Q1 2026 Credit Industry Insights Report (“K-Shaped Path”), comparing Q4 2019 to Q4 2025.
- Federal Reserve Bank of St. Louis, On the Economy, “The Broad, Continuing Rise in Delinquent US Credit Card Debt, Revisited,” May 2025. Delinquency shares of people, by ZIP-income decile, Q1 2025. Levels, not growth: on a share-of-debt basis, delinquency has grown faster since 2022 in the highest-income ZIPs. The K describes where stress sits, not where it is spreading fastest.
- Federal Reserve, Economic Well-Being of US Households in 2025 (SHED), published May 2026. The share able to cover a $400 emergency was unchanged year over year.
- Bank of America Institute, Paycheck to Paycheck series, 2026. Household spending >95% of income on necessities. Pace of growth decelerated roughly threefold versus 2024.
- National Energy Assistance Directors Association, Winter Heating Update, 2026-02-12. neada.org. NEADA is an advocacy association; figures directionally reliable.
- Federal Reserve Bank of New York, Liberty Street Economics, “How Distressed Are Consumers? Reconciling Diverging Credit Card Delinquency Measures,” August 2026.


